| Read No. | Name of chapter |
|---|---|
| 10 | The Call Stack defined on MDN |
| 10 | Understanding the JavaScript Call Stack |
| 10 | JavaScript error messages && debugging |
The Call Stack defined on MDN
A call stack is a mechanism for an interpreter (like the JavaScript interpreter in a web browser) to keep track of its place in a script that calls multiple functions — what function is currently being run and what functions are called from within that function, etc.
- When a script calls a function, the interpreter adds it to the call stack and then starts carrying out the function.
- Any functions that are called by that function are added to the call stack further up, and run where their calls are reached.
- When the current function is finished, the interpreter takes it off the stack and resumes execution where it left off in the last code listing.
- If the stack takes up more space than it had assigned to it, it results in a “stack overflow” error.
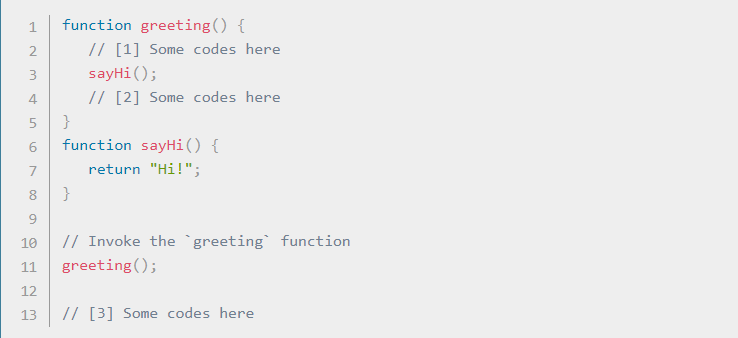
The code above would be executed like this:
1- Ignore all functions, until it reaches the greeting() function invocation.
2- Add the greeting() function to the call stack list.
3- Execute all lines of code inside the greeting() function.
4- Get to the sayHi() function invocation.
5- Add the sayHi() function to the call stack list.
6- Execute all lines of code inside the sayHi() function, until reaches its end.
7- Return execution to the line that invoked sayHi() and continue executing the rest of the greeting() function.
8- Delete the sayHi() function from our call stack list.
9- When everything inside the greeting() function has been executed, return to its invoking line to continue executing the rest of the JS code.
10- Delete the greeting() function from the call stack list.
The JavaScript Call Stack - What It Is and Why It’s Necessary
he call stack is primarily used for function invocation (call). Since the call stack is single, function(s) execution, is done, one at a time, from top to bottom. It means the call stack is synchronous.
What is the call stack?
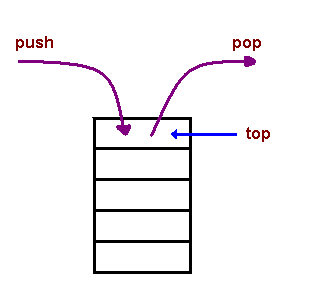
A call stack is a data structure that uses the Last In, First Out (LIFO) principle to temporarily store and manage function invocation (call).
LIFO
It means that the last function that gets pushed into the stack is the first to be pop out, when the function returns.
Temporarily store
When a function is invoked (called), the function, its parameters, and variables are pushed into the call stack to form a stack frame. This stack frame is a memory location in the stack. The memory is cleared when the function returns as it is pop out of the stack.
Manage function invocation
The call stack maintains a record of the position of each stack frame. It knows the next function to be executed (and will remove it after execution). This is what makes code execution in JavaScript synchronous.
JavaScript error messages && debugging
Types of error messages
The first thing that indicates you that something is wrong with your code is the (in)famous error message that the one we saw just moments ago, it usually appears on your console (being developer tools of the browser, terminal or whatever else you are using).
Reference errors
This is as simple as when you try to use a variable that is not yet declared you get this type os errors.
console.log(foo) // Uncaught ReferenceError: foo is not defined
Syntax errors
This occurs when you have something that cannot be parsed in terms of syntax, like when you try to parse an invalid object using JSON.parse.
JSON.parse( {‘foo’: ‘bar’} ) // Uncaught SyntaxError: Unexpected token o in JSON at position 1
Range errors
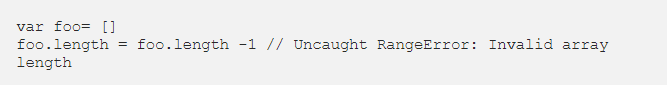
An array for instance cannot have a negative length, why would you mess with the array length? Some people use it to set an array to empty.
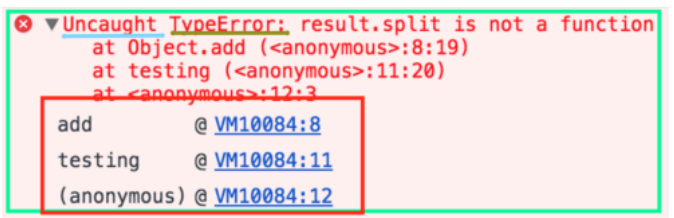
Type errors
Like the name indicates, this types of errors show up when the types (number, string and so on) you are trying to use or access are incompatible, like accessing a property in an undefined type of variable.
Debugging
To debug your JS code, the easiest and maybe the most common way its to simply console.log() the variables you want to check or, by using chrome developer tools, open your page with your JS code (press cmd+o in macOS or Ctrl+o in Windows) and choose your file to debug, click the line you wanna debug and refresh your page again (F5).
If the line you selected was run you will be able to see what has happened before that point and you can try and evaluate the next lines to check if everything is outputting what you are expecting.
The breakpoint can also be achieved by putting a debugger statement in your code in the line you want to break.
You can also add conditional breakpoints by right-clicking a previous set breakpoint, which will make your program stop at that point only if a condition is met, this is awesome for when you want to debug huge cycles for specific values.
Handling errors
When we do not handle errors properly, meaning that anything after that error will not be executed. To avoid this we usually try to catch the errors so we can gracefully fallback to a default state of our application in case of an error (this fallback can be a 404 page which is normally not that graceful but is better than a page to just stop working).
The worthiest outcome of using try…catch tough is the fact that your application will keep on running, maybe with some side effects due to the fact that numberResult now contains an empty array but at least it didn’t just crash onto itself (just make sure the code you have afterwards is bearing in mind the default values of the errors).
Tools to avoid runtime errors
JS is not a compiled language like Java so your errors will happen at runtime, that means that you can only see whatever is wrong with your code after your run it.
Thankfully, to save us quite some time you can use tools like:
- quokka to evaluate your code as you type
- eslint to make sure your style guide is consistency and it will grab you an error or two along the way.